
Google Analytics is possibly the most valuable analytics tool you have available in digital marketing. How else are you going to track visits to your website? Drilling down into the total daily numbers and info on the GA Home screen is important. This is my favorite custom report:
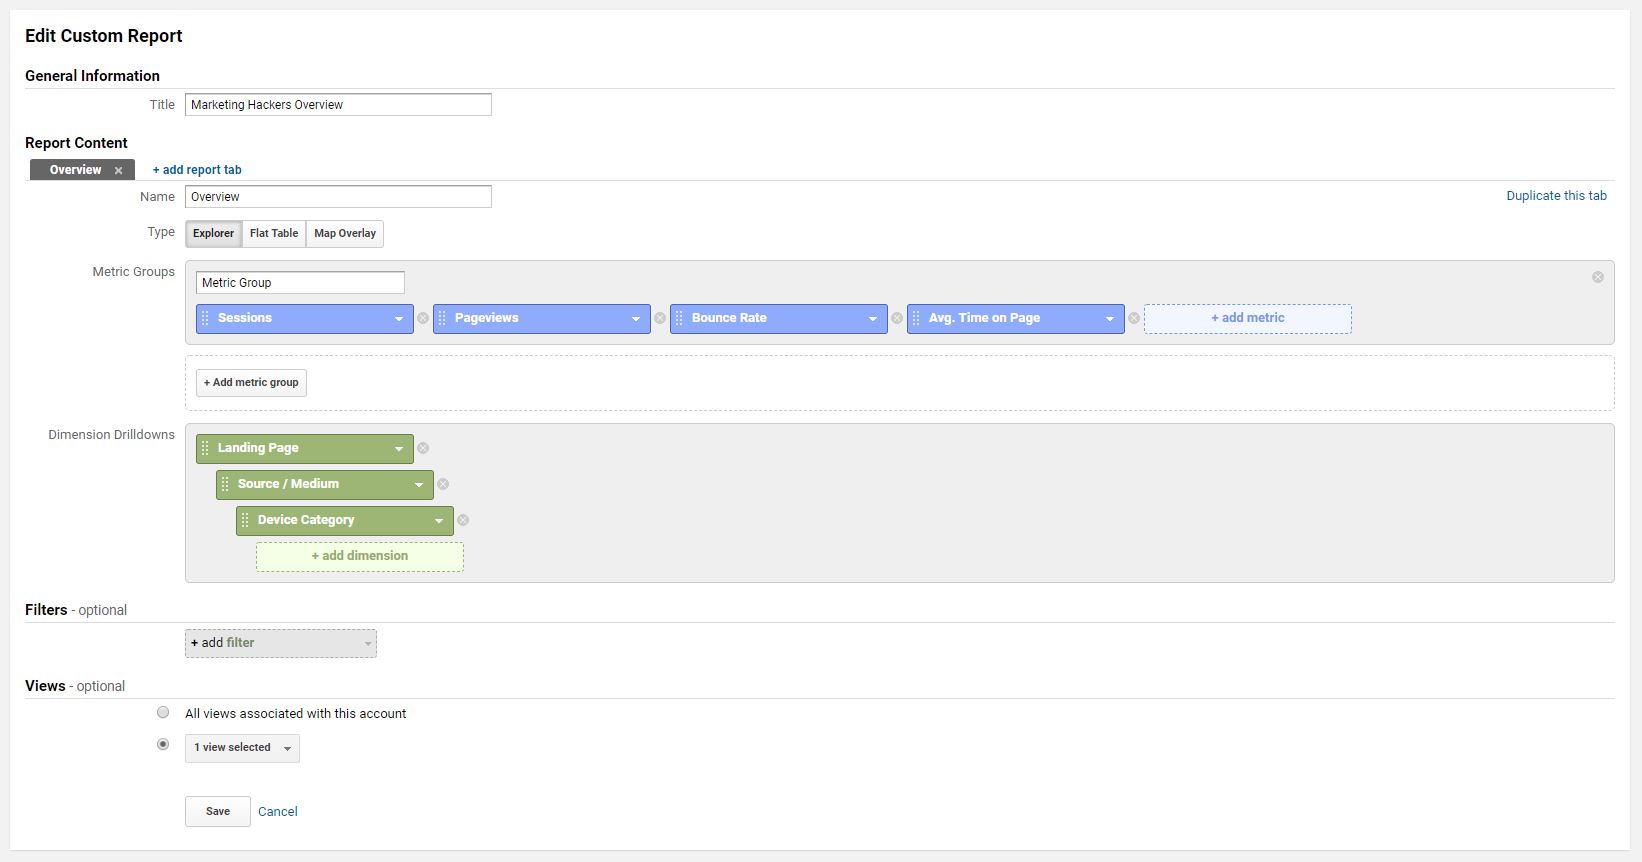
Click save and viola. Take a look at how the drill-downs go. In this screenshot, I used the Google Demo Account with dummy data.
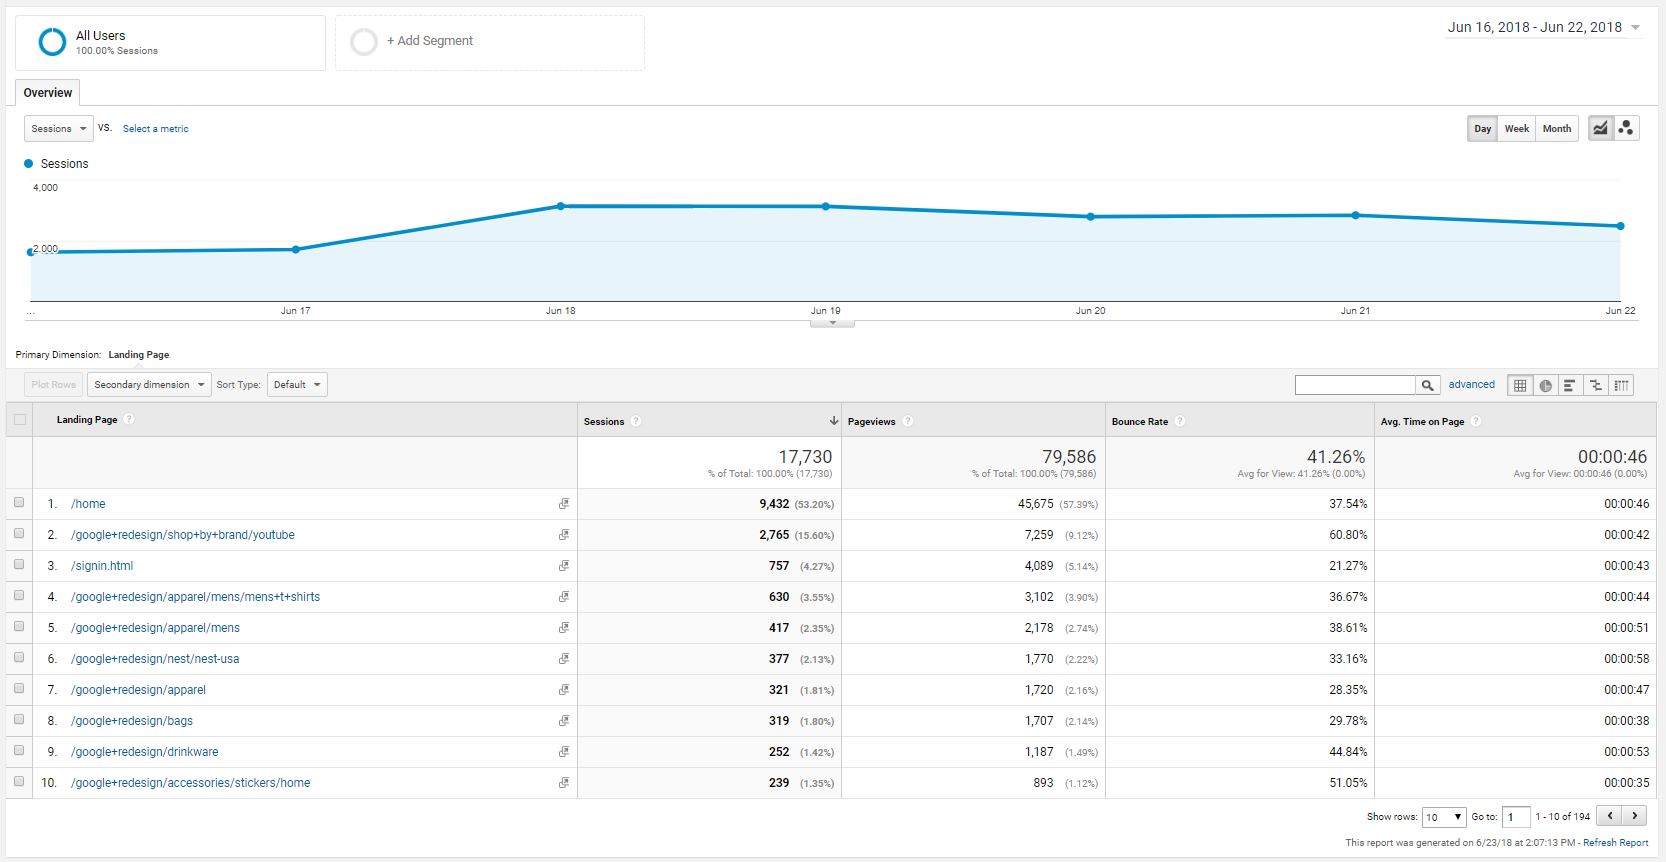
Clicking on a landing page brings you to the source and medium data.
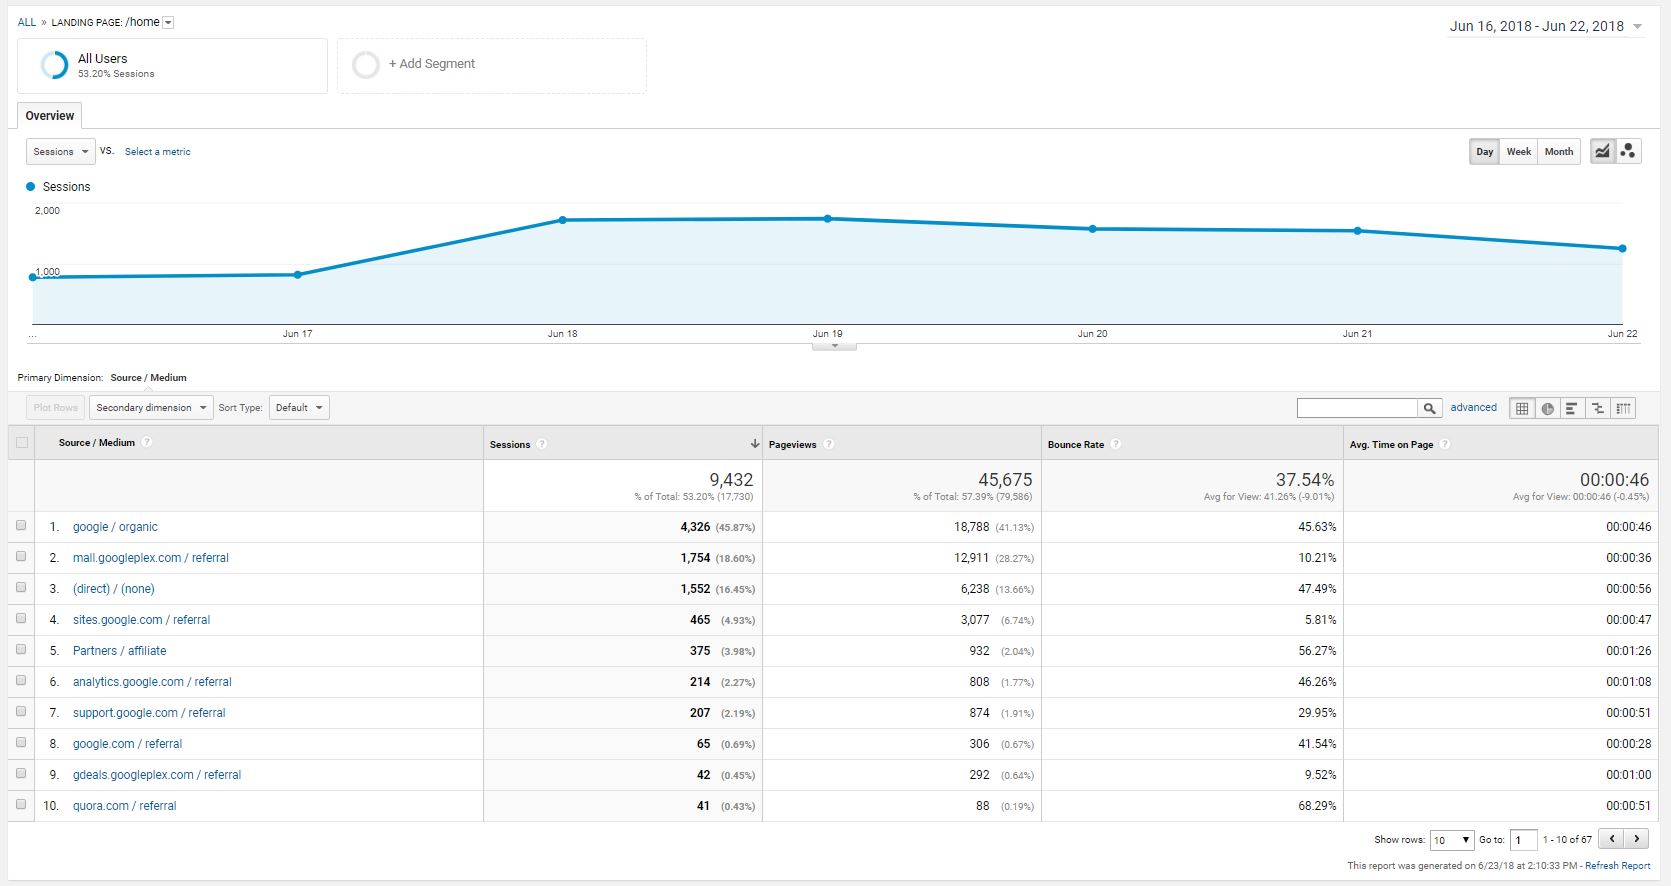
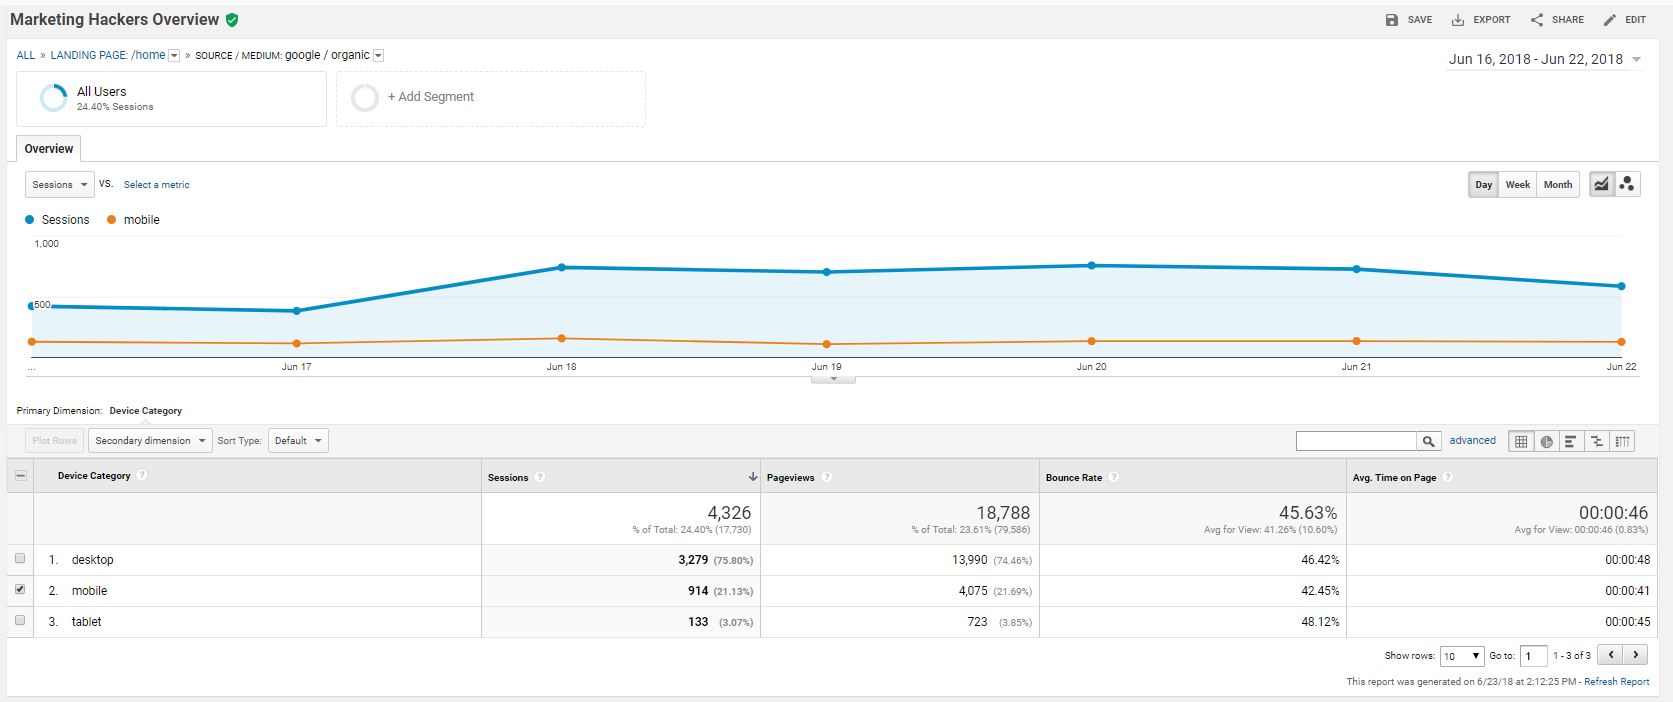
Clicking on a source/medium then brings you to the device drill-down.
Glossary of Google Analytics Terms in Report
Sessions
This is pretty simple. GA defines sessions as “a group of user interactions with your website that take place within a given time frame.” If someone clicks a link to your website or types the URL into their browser, that starts a new session. Sessions typically end after 10 minutes of no activity (you can custom configure this in GA). However, it counts as multiple sessions if say someone comes to your website from a Facebook link, then a couple minutes later comes back to your site from lets say a Reddit link. You want as many sessions as possible (provided your GA tracking is setup right and you’re not having to pay for each one in the form of CPC ads).
Pageviews
Ah the almighty pageview. A pageview is anytime a page on your website is loaded or reloaded by a user. More pageviews mean more chances for users to see ads, read your content, follow your calls-to-action, etc. Typically, the higher the better.
Bounce Rate
A bounce is defined as whenever someone comes to your website and only views one page before leaving. The bounce rate is the percent of single page sessions on your website. Typically, the higher the better.
Average Time on Page
How long users spent, on average, on a page or set of pages on your website. Typically, the higher the better.
See more on average time on page here.
Source / Medium
Source
Where a website session came from. This can be email, Google, Facebook, Yahoo, etc.
Medium
This describes the session further. Common values for this are referral, cpc, organic, or none (for direct clicks). If you’re running a CPC campaign on Facebook, you can differentiate your results between free and paid visits by setting this.
See more on source/medium here.
Landing Page
The page on your website where a session started. Basically, the first page your visitor sees on their visit, whether that’s the homepage, an article page, a product page, etc.
Device Category
What electronic device a session came from. Values for this are desktop, tablet and mobile.
All this make sense? Good. You’ve just started your journey into using Google Analytics to track your website’s visitors, device, how they arrived, where they went and more!
To use this custom report, just click here!

